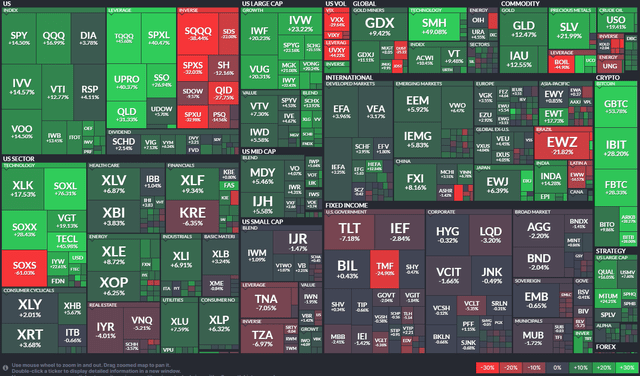
Large-cap growth was the star of the market show in the first half. ETFs tracking the upper-right corner of the US stock market style box returned more than 20%. Contrast that to tepid returns in value and among mid-caps. Small caps were basically flat, losing ground to both inflation and high cash yields.
Let’s revisit the Vanguard Mid-Cap Index Fund ETF Shares (NYSEARCA:VO). I had a buy rating in late October 2023, which proved to be a timely call as that was right near the bottom of the market correction in the second half of last year. But VO is up just 24% in total return since then, underperforming the S&P 500’s 30% return. “Higher for longer” interest rates and AI euphoria among the megacaps have been the primary drivers of VO’s negative alpha.
I reiterate a buy rating, but my mood is less sanguine today given a higher P/E ratio and uncertain technicals.
First-Half ETF Performance Heat Map
Finviz
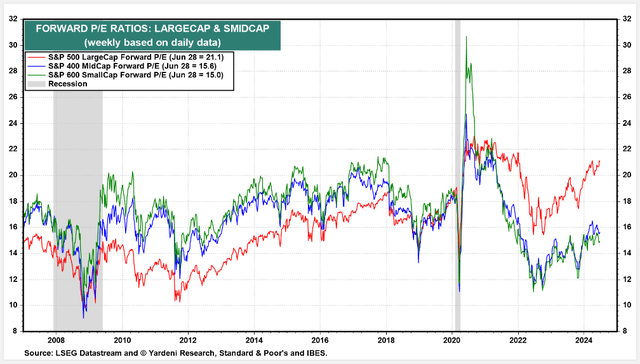
According to the issuer, VO seeks to track the performance of the CRSP US Mid Cap Index, which measures the investment return of mid-capitalization stocks. The ETF provides a convenient way to match the performance of a diversified group of mid-sized companies, and it follows a passively managed, full-replication approach. Yardeni Research points out that the S&P MidCap 400 trades at 15.6 times forward earnings estimates, about 5.5 turns cheaper than the S&P 500. That multiple is up about 3.5 handles from October last year.
S&P Index Valuations
Yardeni Research
VO is a large ETF with $163 billion in assets under management as of June 28, 2024. The fund sports strong ETF Grades by Seeking Alpha. Its 0.04% annual expense ratio is very low, earning the fund an A+ in that category. VO pays just a 1.6% trailing 12-month dividend yield, but that is a bit above the yield of the S&P 500. Share-price momentum remains decent, but has turned less strong compared to earlier in the year.
Being a low-cost and diversified equity ETF, VO has generally favorable risk ratings. Muted volatility across markets lately has helped keep the ETF’s standard deviation in check going back to November 2023. Finally, VO is highly liquid, averaging more than 500,000 shares daily with a 30-day median bid/ask spread of just two basis points, per Vanguard.
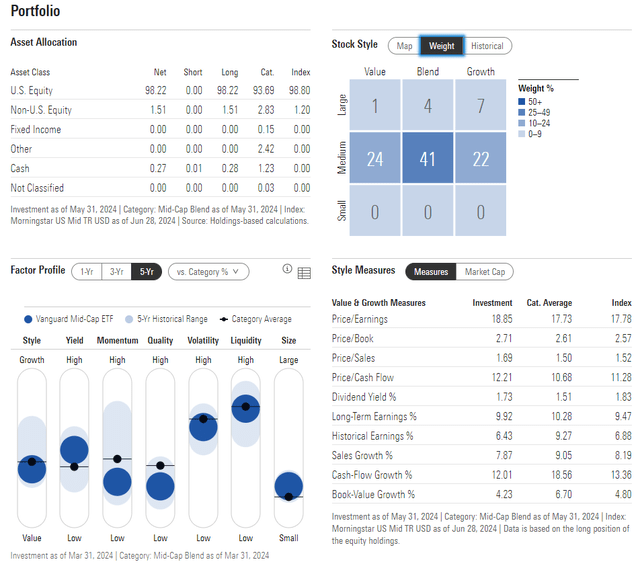
Looking closer at the portfolio, the 4-star, Gold-rated ETF by Morningstar plots across the middle of the style box, but Morningstar’s assessment puts the fund partially into the large-cap row. What’s ideal for investors seeking diversification is that there’s about an even split between value and growth whereas the SPX is tilted to growth. The allocation’s P/E is now close to 19, which is not a bargain, but long-term EPS growth is near 10%, resulting in a decent PEG, but by no means a screaming deal.
VO: Portfolio & Factor Profiles
Morningstar
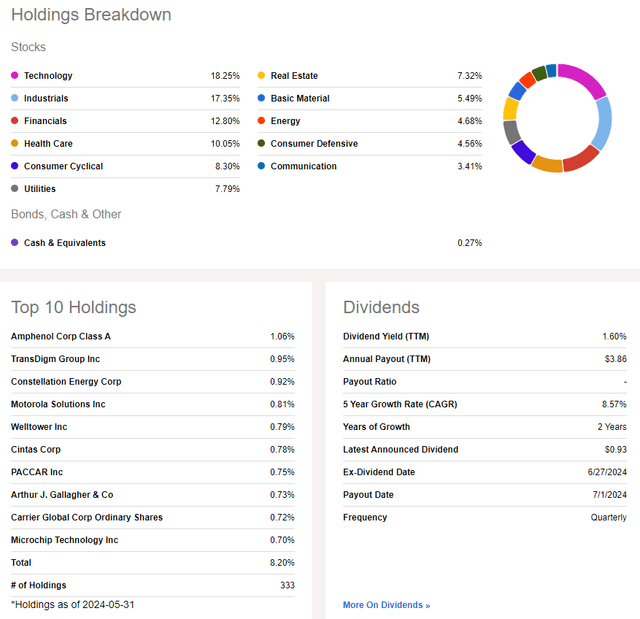
Last year, I highlighted that mid-caps have quietly outperformed both large- and small-cap stocks throughout history, and I like how VO’s complexion today has a nice mix of growth and value sectors. Information Technology edges out Industrials for the biggest weight while Financials and Health Care are both north of 10%.
VO: Holdings & Dividend Information
Seeking Alpha
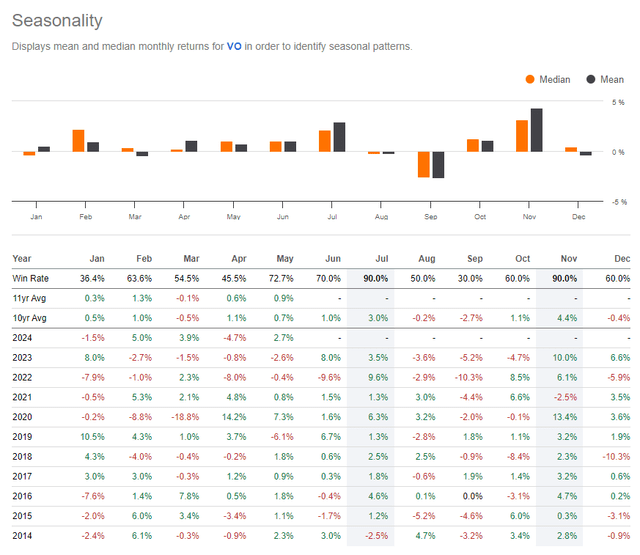
Seasonally, July is historically a strong month, but volatility has typically perked up from August through early October in the past 10 years. 2023’s seasonal price action played out nearly to a T, and mid-caps are not too far from multi-year highs heading into the second half of 2024.
VO: Bullish July Trends, Weak August-September
Seeking Alpha
The Technical Take
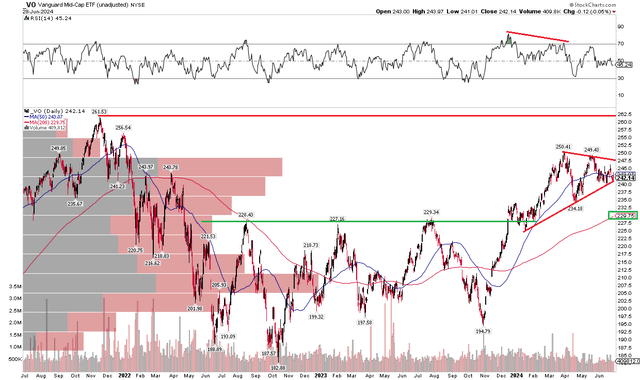
With a higher valuation today and underperformance to large-cap growth, VO’s technical chart is generally favorable, but there are indicators to monitor. Notice in the graph below that shares are currently consolidating in a symmetrical triangle with an apex that would be in the low $240s. A rally through the 2024 peak of $248 would be bullish, suggesting an upside measured move price target to near $265 based on the height of the current coil pattern. A breakdown under $240 may lead to a fall into the low $220s, however.
But take a look at where long-term support appears. The $227 to $230 zone was key resistance time and again from Q2 2022 through the middle of last year. Shares also consolidated there before rallying earlier this year. I see that spot as the likely area where the bulls will defend VO. What’s more, the ETF’s long-term 200-day moving average is rising, currently just shy of the $230 mark. While the RSI momentum gauge at the top of the chart has been deteriorating over the past six months, it has not spent much time in technical oversold conditions.
VO: Bullish Consolidation, Shares Remain Under the 2021 Peak
Stockcharts.com
The Bottom Line
I have a buy rating on VO. While the ETF is more expensive on a P/E basis today, the valuation remains decent while technical price action is generally favorable.
Read the full article here


Leave a Reply